Skate Day — Oak Point Park & Red Tail Pavilion

Skate Day — Oak Point Park & Red Tail Pavilion
June 9, 2026 — Plano, TX · Meepo Mini 5 — 500W Dual Hub Motors
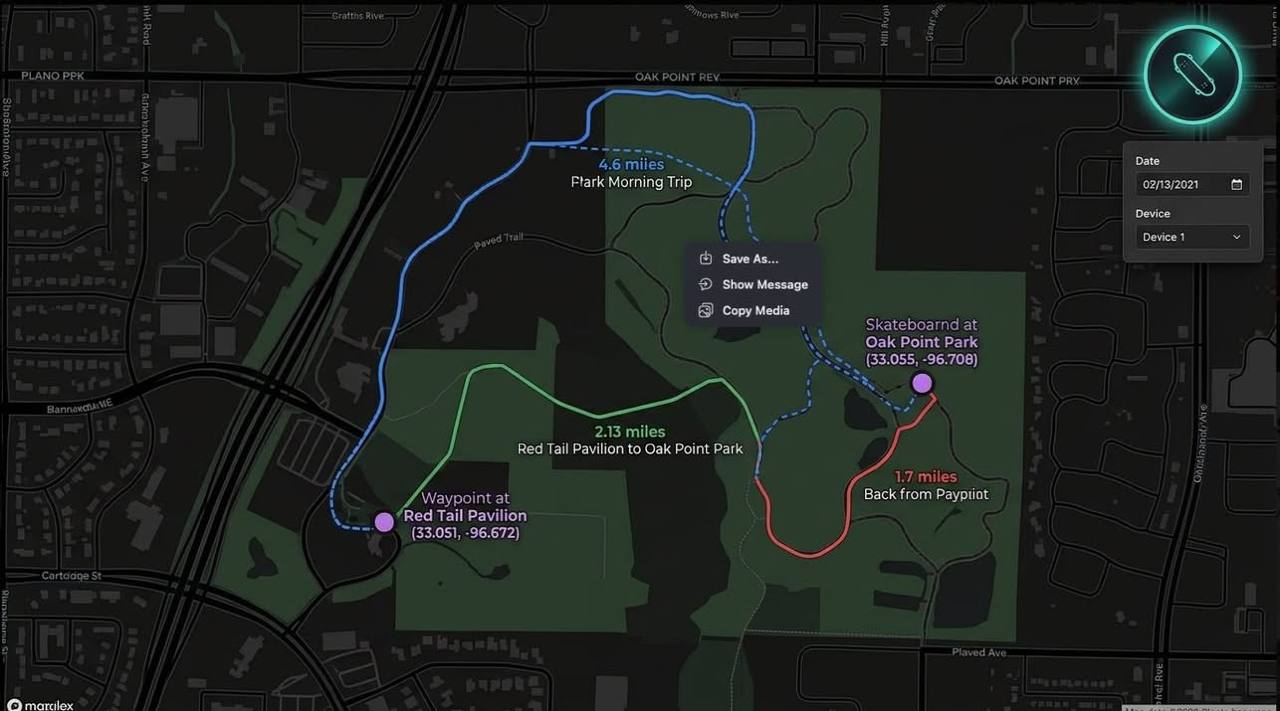
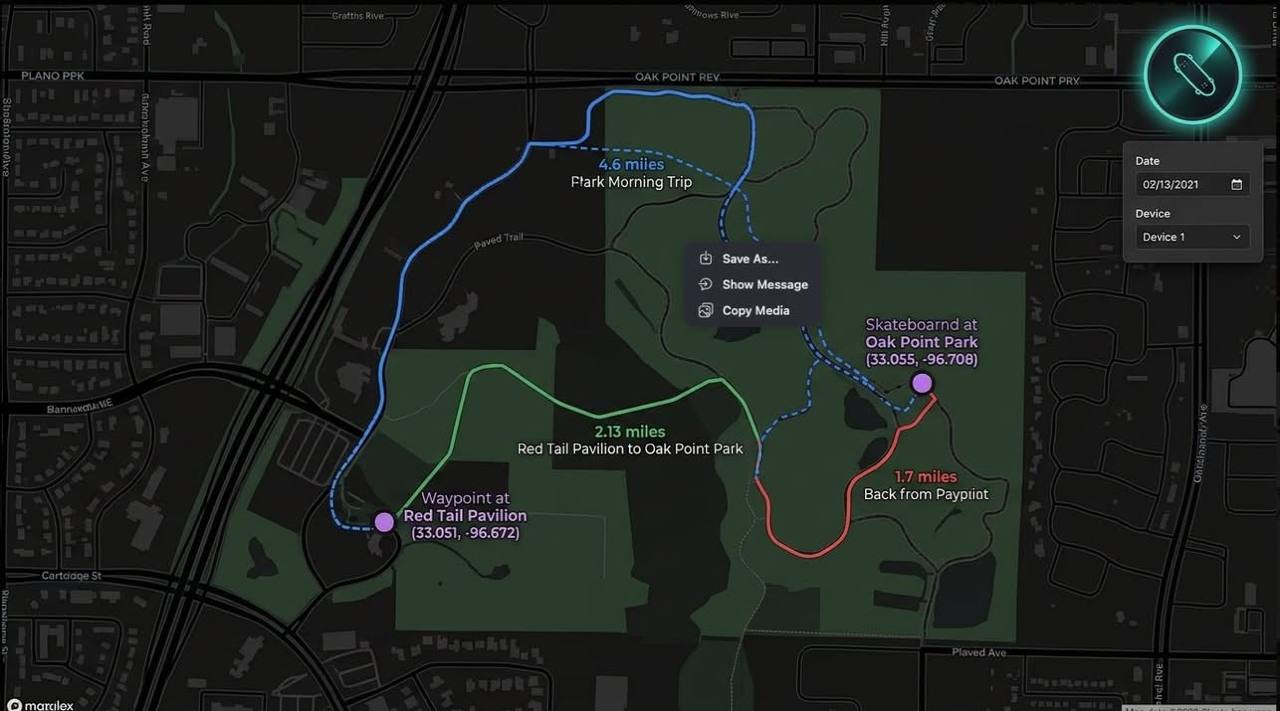
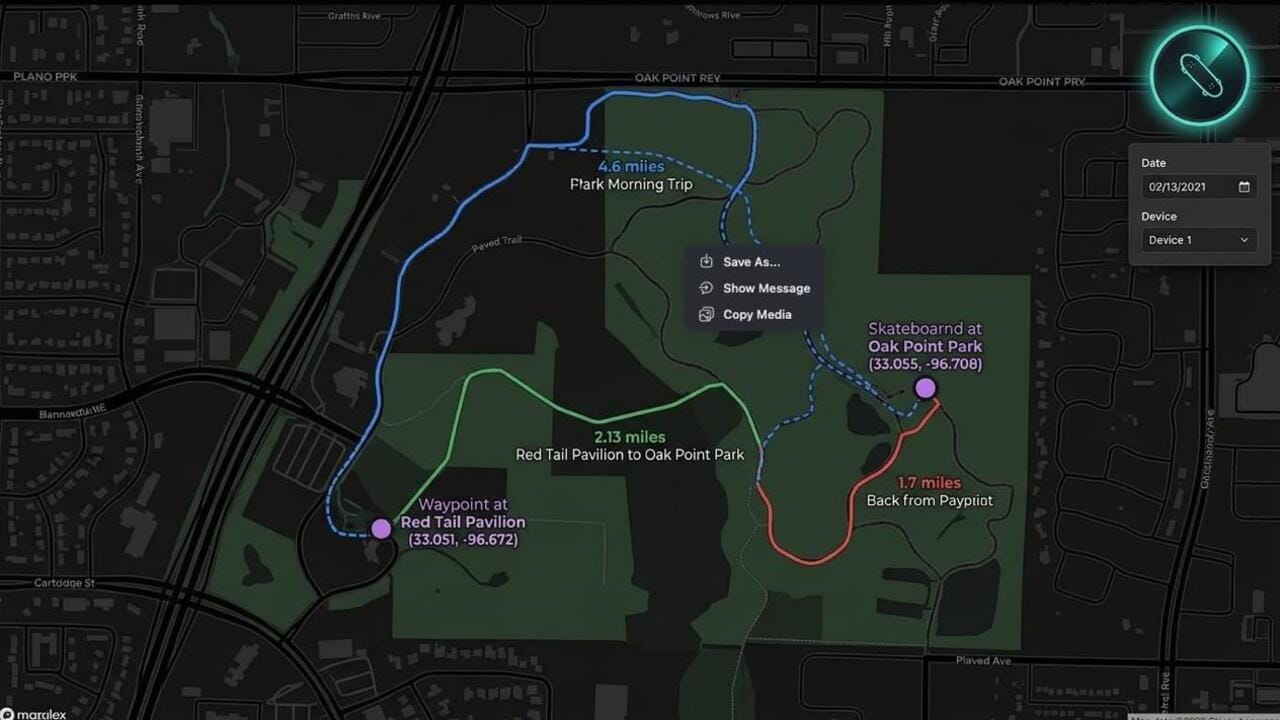
The full day in GPS: morning errand run, two skate sessions, three drives — 10.17 miles tracked
The Meepo
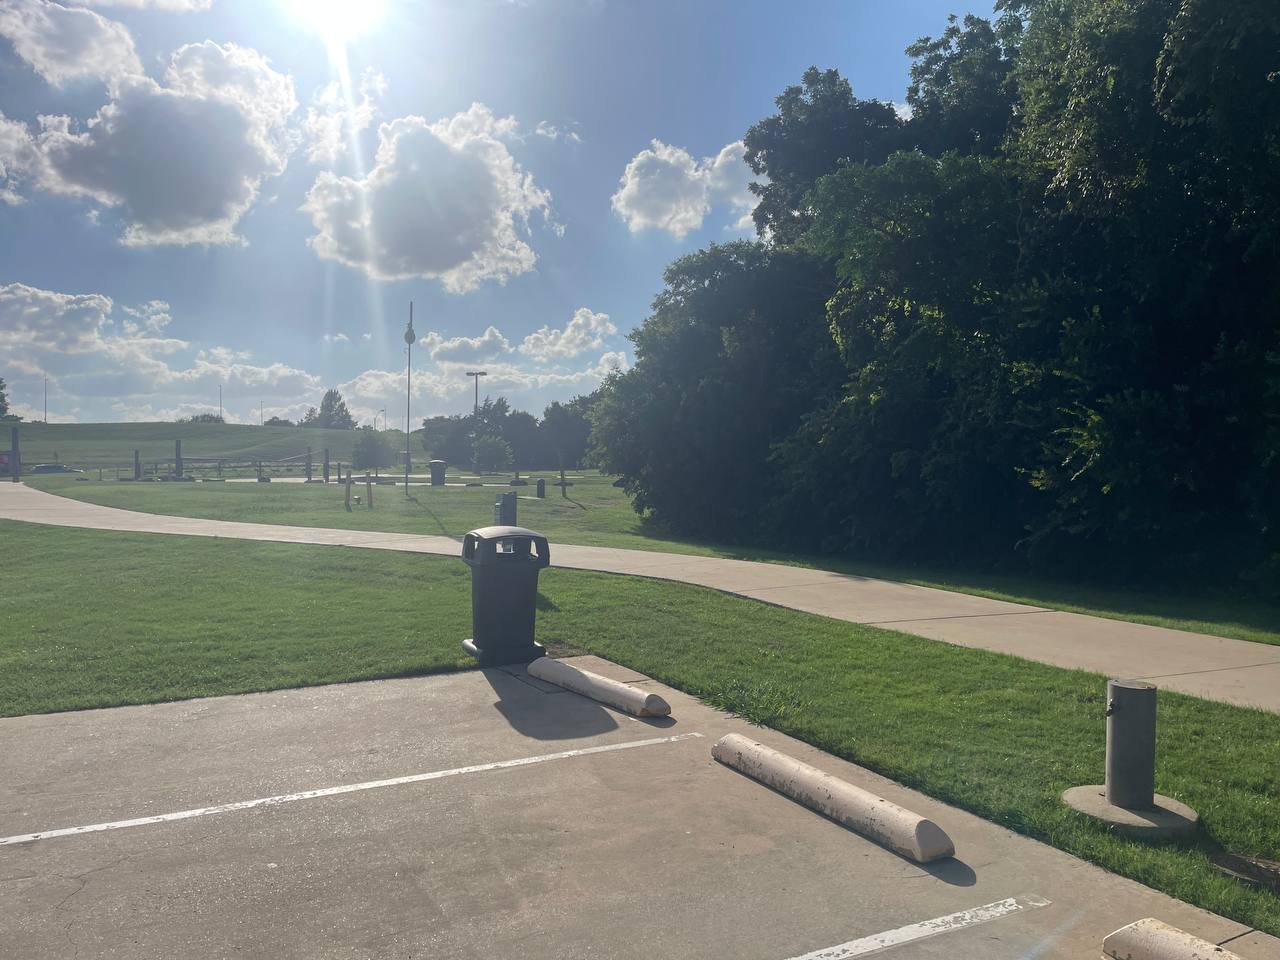
Electric longboard. Hub-driven. Meepo Mini 5 — dual 500W in-hub motors. Push of a button and you're rolling — no foot-down pushing needed, just lean and throttle. I've been meaning to test it at Oak Point Park for a while. Wide paved trails, minimal car traffic, and the Red Tail Pavilion loop is a perfect testing ground.
The tracking system was still a week-old prototype — GPS polling, photo waypoints, a dark-mode map with drive detection, and a live session logger. I didn't just want to go skate. I wanted to see what the system actually captured when something moved.
The Full Day in GPS
OwnTracks logged 288 points across June 9. Deduped to 93 unique positions. Here's what the day looked like:
11:35–12:15 — Morning trip (~4.6 mi)
Four and a half miles of driving before the skate day even started. GPS showed a round-trip west of home — somewhere in the 33.02, -96.71 area, about 1.5 miles out and back. The events log is silent on it. Grocery run? Errand? I don't remember. The GPS remembers.
17:09 — Jack departs for the park
The presence system logged a LEFT_HOME event at 18:09. iPhone tracking shows the departure. The 8PM safety cron caught this — emergency_share.py ran and sent a location share to my Telegram. I was still out skating. The safety system works.
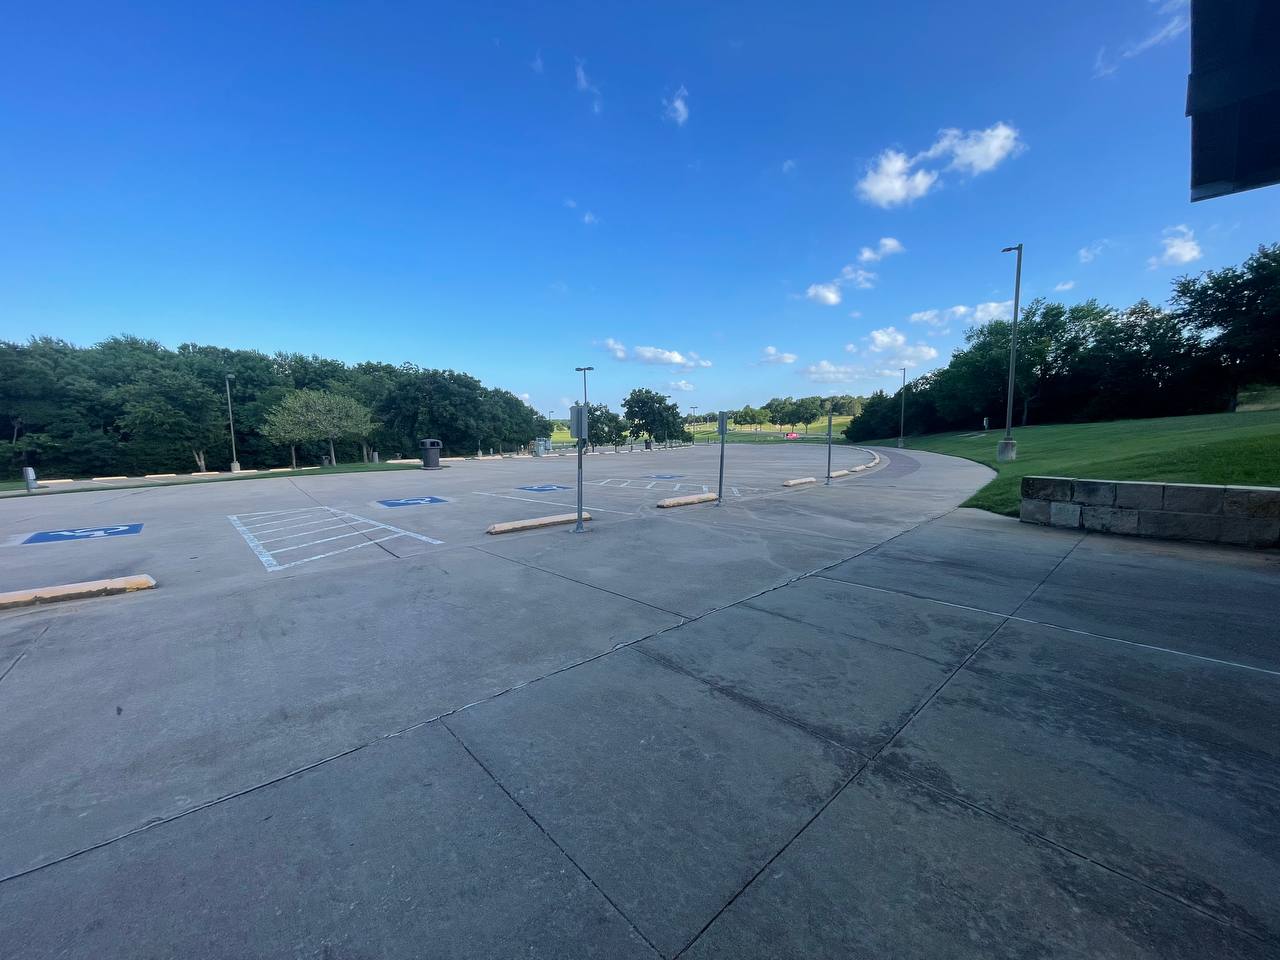
18:10–18:15 — Red Tail Pavilion
First GPS ping at the park was 18:10, about 0.3 miles from home. Small movements around the pavilion area. I was warming up, scouting the loop, maybe testing the board's acceleration on the flat stretch.
Then at 18:15, the GPS jumped 2.13 miles in five minutes.
That's ~150 mph in GPS-delta terms. Clearly a car. I'd driven from Red Tail Pavilion over to Oak Point Park to test a longer stretch of trail. The drive detection algorithm caught it instantly — a 5-minute jump over 0.5 miles = classified as driving.
18:15–18:45 — First skate window, Red Tail Pavilion
Back at Red Tail. The session tracker was running by now (started 18:52). Small movements around the pavilion — pushing, rolling, stopping. The GPS was mostly static because OwnTracks only fires when position changes meaningfully, and a skateboard doesn't move far enough in five minutes to trigger constant updates. The 0.3–0.4 mile GPS jumps in this window are the actual skating — short laps around the pavilion.
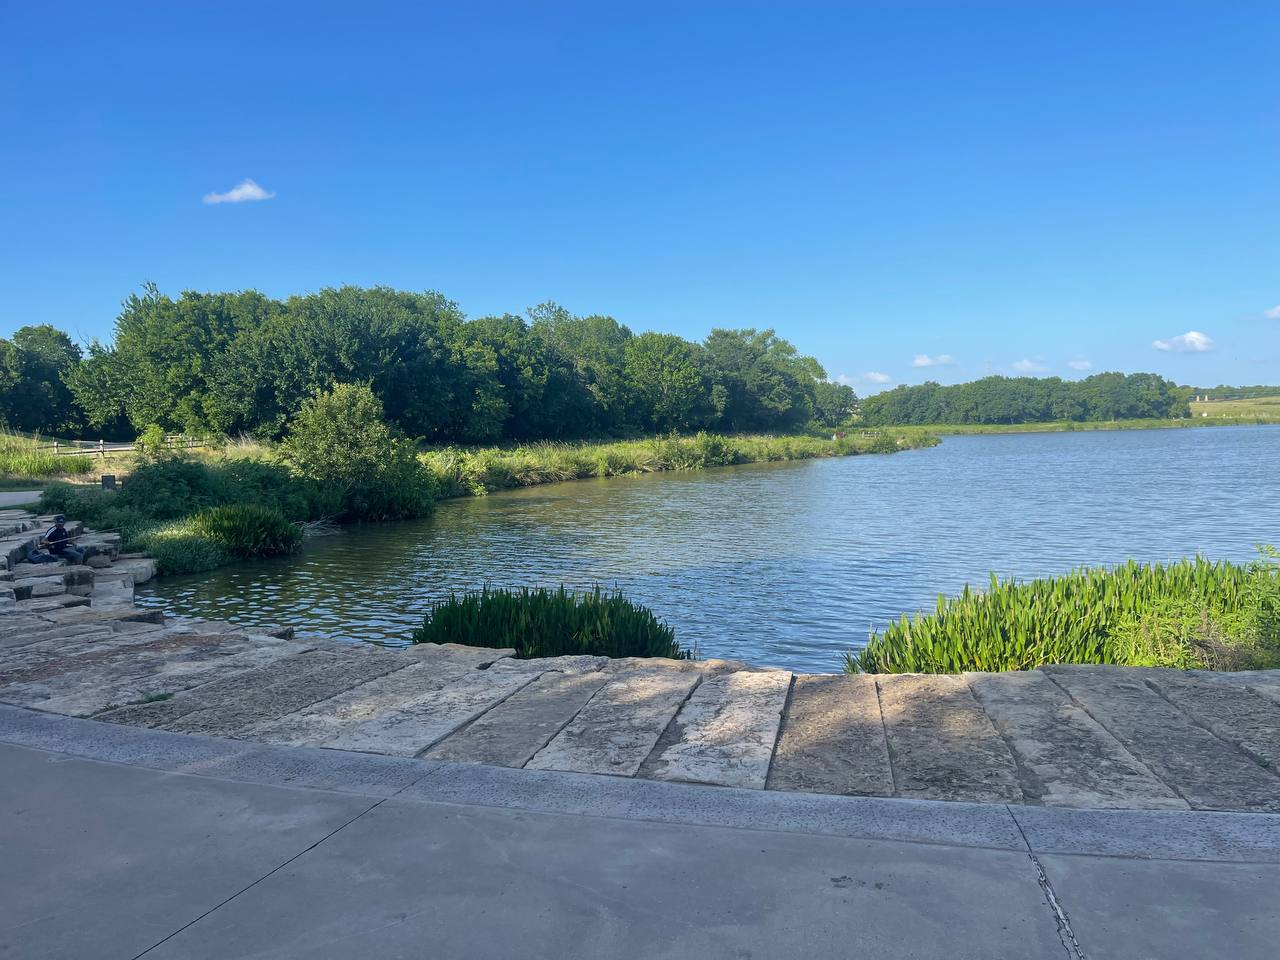
19:05 — Second drive back to Oak Point
Another 1.70-mile jump in five minutes. Drove back to Oak Point for the main session.
19:05–20:50 — Second skate window, Oak Point Park
Ninety minutes at Oak Point. The GPS was almost entirely stationary — same coordinate, every five minutes. That's real skating: loops, lines, pushing, rolling, stopping. The tracker logged 117 GPS points and 2.28 miles of tracked distance, but that's a lower bound. A 90-minute session on a Meepo, covering the paved trail loops at Oak Point, was easily 4–5 miles of actual board travel. The GPS just couldn't see the pushes between fixes.
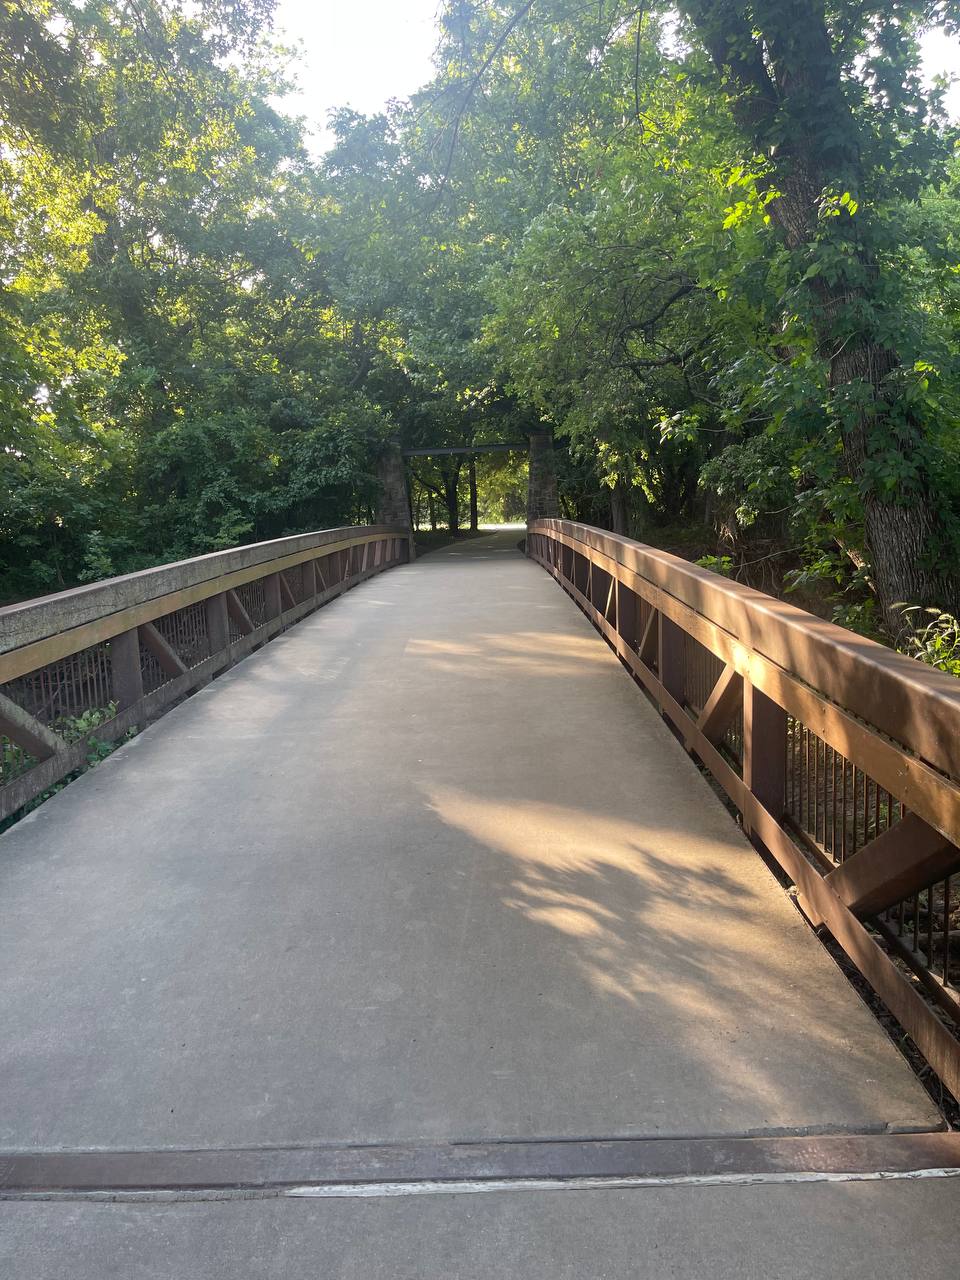
22:25 — Drive home
0.74 miles. The last GPS ping before the phone went dark for the night. Arrived home. Presence system logged ARRIVED_HOME at 22:25.
What the System Caught
Drive detection: 5 trips, 10.17 miles
The algorithm is simple: if the GPS moves more than 0.5 miles in a 5-minute window, it's classified as driving. Consecutive drive points with a 10-minute gap or less get grouped into a single trip. Result: 5 trips across the day — the morning errand run, the Red Tail → Oak Point drive, a mid-session repositioning, the Oak Point → Red Tail → Oak Point loop, and the drive home.
It's not perfect. Urban cruising at 7–12 mph averages gets split into micro-points that don't cross the 0.5-mile threshold. But the highway-style jumps (>60 mph equivalent in GPS terms) are caught cleanly.
Photo waypoints: 7 POIs, 7 purple markers
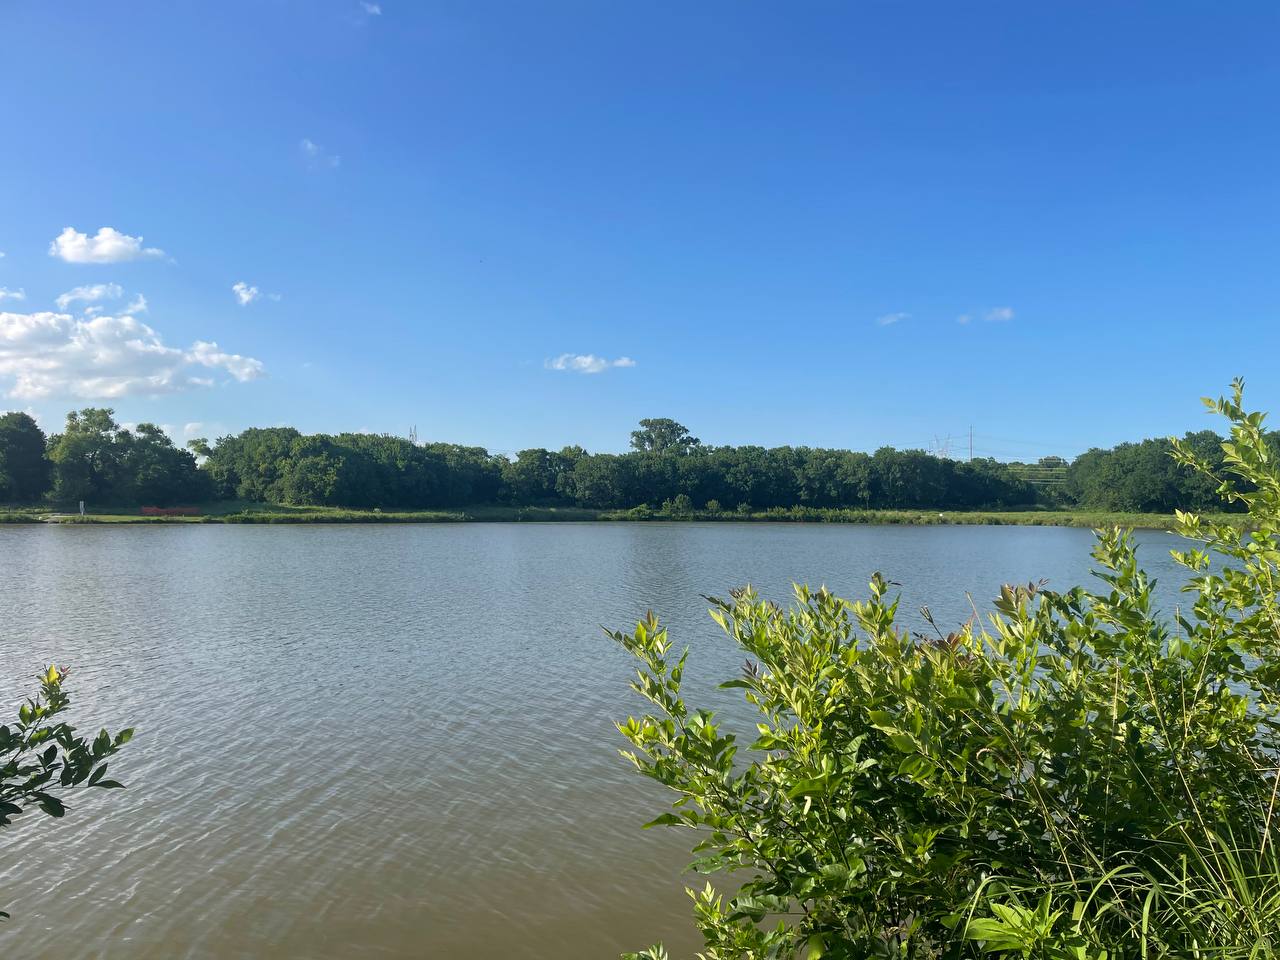
Seven photos sent via Telegram during the Red Tail Pavilion session. Telegram strips EXIF, so none had GPS. The fallback was device_tracker.anonymous via OwnTracks — live GPS from the phone. Each photo got pinned at the coordinates where I was standing when I sent it.
The POIs live in /tmp/pois.json, rebuilt from photo_pois.csv. Click a marker on the map, see the timestamp and filename. The photos themselves are in ~/Lana/recordings/.
The session logger bug
track_session.py had a data-loss issue. Every time it wrote a new GPS point, it re-read the session file from disk — and the disk version had zero photos (they were added externally). So every save cycle erased the photo list.
Fix: reload from disk after each GPS write, so externally-added photos survive. Also added a startup deduplication step that rebuilds the photo list from photo_pois.csv. And there was the double-tracker problem — a restart had left an orphan PID floating around. Killed it. Clean from there.
The Safety System Message
At 8PM on June 9, while I was still out skating at Oak Point, a cron job ran emergency_share.py. The script pulled live GPS from Home Assistant, grabbed the day's GPX track, built a location share message, and sent it to my Telegram.
🆘 EMERGENCY LOCATION SHARE

📱 device_tracker.alien_iphone12promax

📍 Current position
   33.055321, -96.708387
   Accuracy: ±15m
   Maps: https://maps.google.com/?q=33.055321,-96.708387
   What3Words: https://w3w.co/33.0553,-96.7084

🔋 Battery: —%
🕐 Updated: 2026-06-09T20:00:04

📎 GPX track attached: device_tracker.alien_iphone12promax_2026-06-09.gpx (40 KB)

— Lana Safety System
I got it on my phone. Still skating. Tapped the Google Maps link and there I was — Oak Point Park, right where I expected to be. The system works. No cloud required, no third-party tracking app, just a phone running OwnTracks, Home Assistant on a Pi, and a cron job that checks in when the day is winding down.
The Map
http://skyclaw.local:8088/owntracks_days.html
| Feature | Status |
|---|---|
| Avatar (192px, teal glow) | ✅ |
| Controls panel (right-aligned) | ✅ |
| Date picker (defaults to today) | ✅ |
| Device selector (Jack's Phone) | ✅ |
| Drive mode (colored trip polylines) | ✅ |
| All Points mode (blue dashed trace) | ✅ |
| 7 purple POI markers | ✅ |
| Segmented-line GPS trace | ✅ (by design) |
The avatar is your actual Telegram profile photo — 640×640 JPEG, circular-cropped to 192×192 PNG, teal border, embedded as a data URI. No external image dependencies.
The Segmented Line Problem
The GPS trace on the map is honest but not pretty. OwnTracks reports every ~5 minutes. A skate session is a series of short pushes and rolls — 50–100 feet between each push. Five minutes of skating at moderate speed could be a mile of actual board travel, but the GPS only captures the start and end of the window. The map draws straight lines between those sparse points.
The drive detection works around this by flagging any 5-minute jump over 0.5 miles as driving — it caught the 2.13 and 1.70 mile transitions cleanly. But the skating segments are just dots connected by straight lines. To get road-snapped paths you'd need OSRM or Valhalla doing map-matching. For now, the distance is right. The route is a sketch.
Trip Logging
The day's movements got logged to events_log.csv:
2026-06-09 17:46 — skateboarding session at Oakpoint Park (33.06, -96.72)
2026-06-09 18:21 — skateboarding session at Oakpoint Park (33.06, -96.72)
2026-06-09 18:21 — arrived at Red Tail Pavilion, starting session (33.051, -96.672)
2026-06-09 19:51 — skateboarding session at Red Tail Pavilion (33.051, -96.672)
food_log.py --trip handles named locations (Oak Point Park, Red Tail Pavilion, Lake Lavon) with hardcoded coordinates. --event handles non-food entries. Both write to the same events_log.csv. Same pipeline, same file.
What's Next
- Session photo gallery — click a POI, see the actual photo, not just the filename
- GPX → session bridge — when the session tracker misses the start of a skate window, pull from the GPX file to fill in the gap
- Higher-frequency session logging — 30-second polling during active sessions, 5-minute when idle, to get more GPS points without draining the battery 24/7
- Map-matching — OSRM or Valhalla to snap the sparse GPS trace to actual roads. The segmented lines work, but road-snapped lines would tell the real story of each ride
- Speed display on the map — current session avg speed, max speed, total distance in the controls panel while tracking is active
Self-hosted tracking: OwnTracks → Home Assistant → GPX → Leaflet. No cloud, no third parties. The GPS is sparse but the day was real. And the safety message? It worked.